Products / overview

What insigz
actually is.

A long-form, technical overview. Reads like documentation, not marketing. If you want the brand-level pitch instead, the homepage covers it in 90 seconds.

AUDIENCETechnical evaluators
UPDATED02.06.2026
CONTENTS
/01 · DATA MODEL

Source → Observation → Entity → Event → Case → Report.

CANONICAL CHAIN · 6 NOUNS

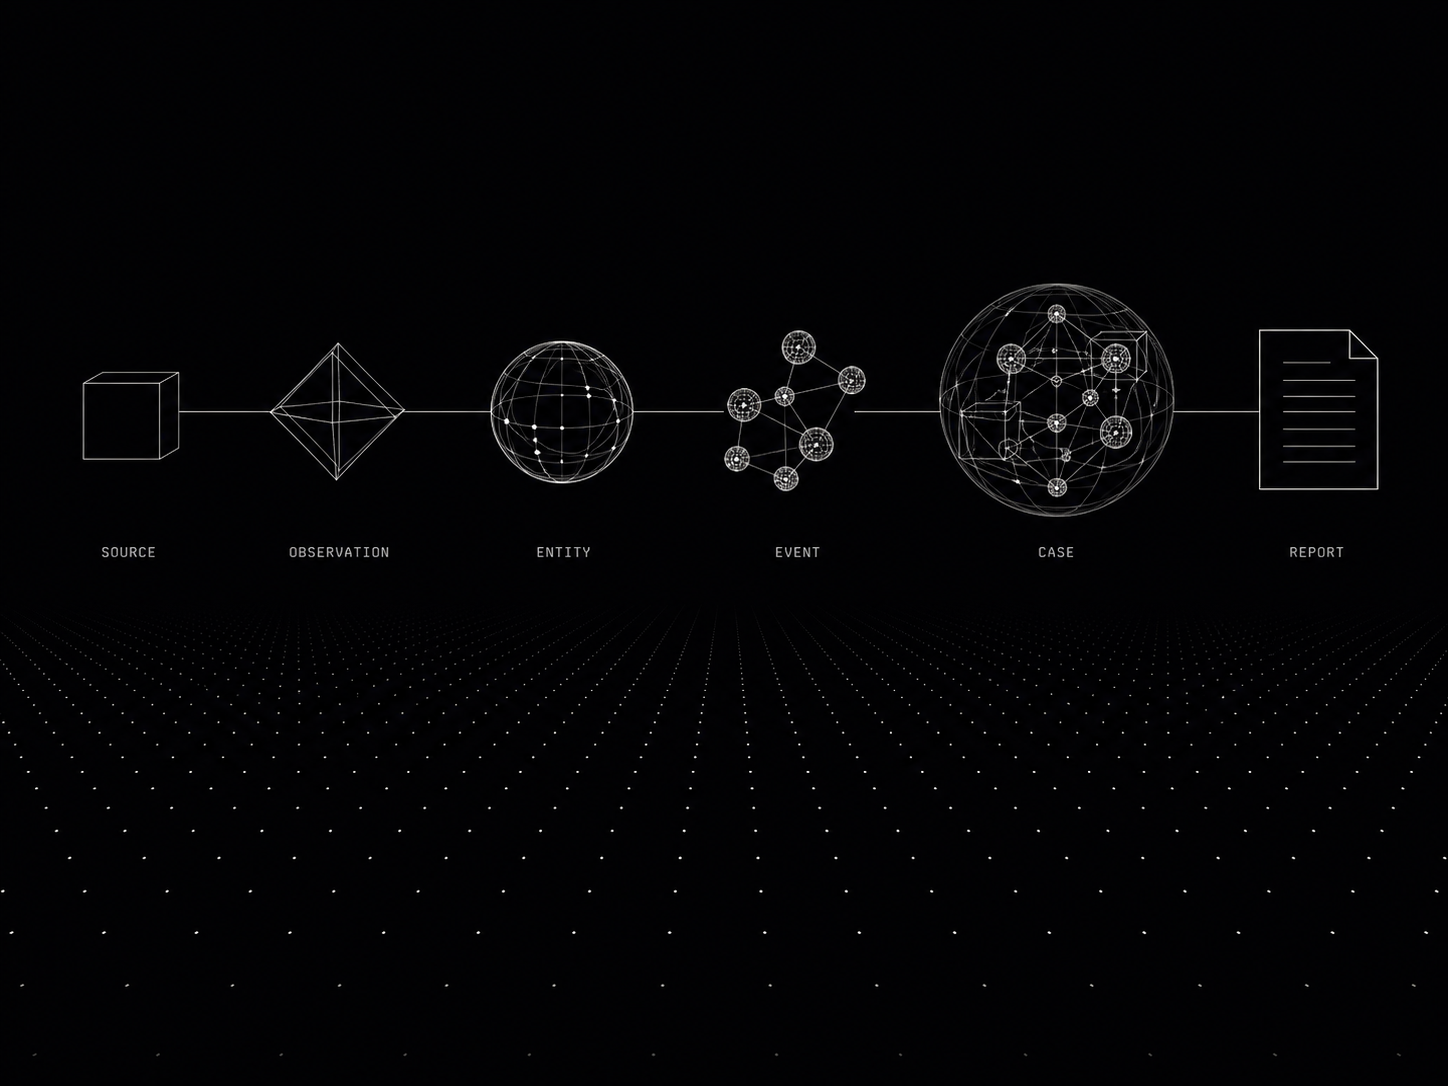
Every table in every insigz tenant is one of: a source registry, an observation log, an entity table, an event log, a case binding, or a report manifest. There are no exceptions.

Source. An external system we read from. ais.marinetraffic, entso-e.transparency, ofac.sdn. Each source has an ingestor, a polling cadence, and a signature.

Observation. An atomic, timestamped, geolocated fact produced by an ingestor. Immutable. Signed by its source.

Entity. A noun in the world — vessel, cable, port, substation, sanctioned party, news outlet. Entities accumulate observations and have stable canonical IDs.

Event. A change in entity state, derived from one or more observations. cable-throughput-drop, ais-gap, designation-added. Carries confidence and back-references to its constituting observations.

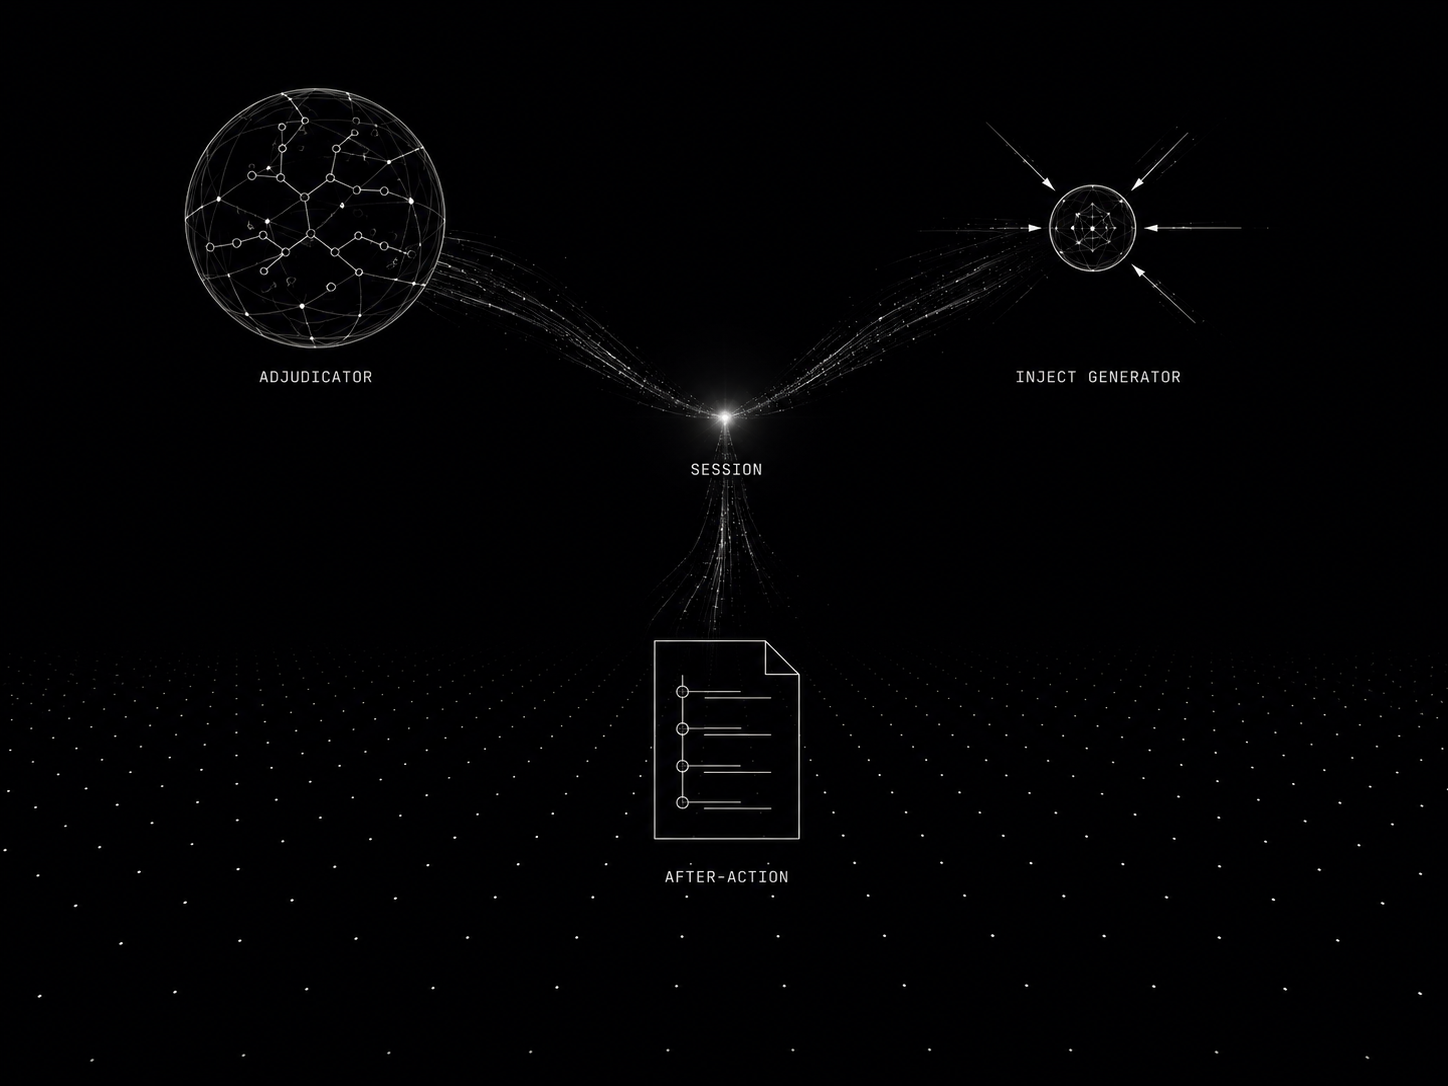
Case. A bound collection of events that mean something together. Cases are the unit of analysis. Cases produce reports.

Report. The artifact that leaves the platform. Signed PDF or web export, every claim cited to source observations.

Five nouns are enough to describe everything insigz models. We add no new nouns; new sources, new entities, new events all fit the existing chain.

Full data model in docs →

/02 · INGESTION

Many live sources. One canonical pipeline.

FUSED FROM · 7 SOURCE FAMILIES SHOWN

Every source family ingests through the same shape: fetch → normalize → geolocate → sign → write. The detail of any specific source (an OpenAPI spec, a CSV download, a WebSocket stream, an HTML scrape) is hidden inside the ingestor.

The source families currently live in insigz:

  • Maritime — vessel positions, port states & identity
  • Energy — grid mix, cross-border flows & day-ahead prices
  • Sanctions — designations & consolidated watchlists
  • Weather — forecast, wind & sea state
  • Aviation — live flight positions & airport reference
  • News — open-source global news
  • OSINT — beneficial ownership, leaks indices, archived sources

Preview — The Ontology Agent collapses the old 2–5-day, two-specialist onboarding into a guided chat: drop a feed and it profiles the payload, drafts the connector and the field→Observation mapping, fits it to your existing entity/event types (reuse over new), proposes resolution keys, and dry-runs the result against a live sample. A human still commits every schema change (doctrine Q9) — so the canonical model stays stable, never forked. How the Ontology Agent works →

/03 · FUSION

Observations into entities, entities into events.

FUSION RESOLVES · ENTITIES + EVENTS

The fusion engine reads new observations and decides three things: which entity the observation belongs to, whether the observation changes state (and therefore creates an event), and how confident we are in the resolution.

The entity-resolution algorithm is four-tier:

  • Tier 1 — canonical IDs. IMO numbers, MMSI codes, sanctions IDs, ISIN. Hard joins.
  • Tier 2 — fuzzy name + locale. Trigram match on names within a geographic / temporal window.
  • Tier 3 — embedding similarity. pgvector cosine over entity-description embeddings.
  • Tier 4 — analyst override. Manual binding via the workspace; carries forward to future observations.

Each resolution carries a confidence score. Confidence below threshold → flag for analyst review. We never silently dispose of an observation; if we can't bind it, we surface the orphan.

Event detection is similar: derived from a state diff on the bound entity. vessel.flag changed RU → CY produces a flag-change event. The event carries provenance back to the two observations that established the diff.

/04 · ANALYST CHAT

Claude over the data, not over the model.

FRONTIER LLMs · STRUCTURED TOOL USE

Claude is the analyst's interface to the data model. The analyst asks a question in natural language; Claude parses it into structured tool calls; the tools run against the canonical data; Claude composes an answer that cites every claim back to source observations.

An analyst asks:

pre>span class="c">"show me vessels off Klaipėda that turned off AIS in the last 48h and are owned by sanctioned entities"/span>/pre>

Claude doesn't try to remember which vessels those are. It calls tools — vessels.near(port="Klaipėda"), vessels.ais_gaps(since=48h), entities.sanctions_exposure(ids=…) — and assembles the answer from the actual data. The response includes clickable citations to the underlying observations.

The discipline: Claude never asserts a fact the data model can't support. If the data is missing or stale, Claude says so. Hallucinated citations are a launch-blocker; we monitor for them and flag in CI.

We route across a family of frontier models — a high-capability model for analyst-facing chat, a mid-tier model for routine inference, and a fast, cost-tuned model for high-volume tasks (intake classification, embedding generation).

classification, embedding generation)./p>

/05 · WORKSPACE

Map-first. Light by default. Dark when it earns it.

THE ARENA · ROLE-SCOPED OPERATING PICTURE

The analyst's working surface is a map plus a chat plus a case. Maps render via MapLibre GL; analyst chat sits in a side panel that can dock or float; cases bind related entities and events into a workspace that becomes the basis of the next report.

Two surface modes, plus the Arena:

  • Light — default for the workspace, authoring and faculty admin. Anduril-light register.
  • Dark — projector use and low-light briefings. Functionally identical to light; switch any time without losing your place.
  • The Arena — the role-scoped session surface. Each cell sees only its own world (asymmetry enforced at the data layer); compose actions on a live map, advance phases, and an Adjudicator drafts the consequences.

Density is configurable per surface. The approval queue and audit log are compact; everything else is "standard."

/06 · PER-TENANT

Single-tenant always.Multi-tenant never.

ONE DATABASE · ONE SERVICE · ONE KMS KEY

Every customer engagement runs in its own Postgres database, its own Cloud Run service, its own KMS keys. There are no shared schemas, no shared rows, no shared inference paths. Two customers cannot query each other's data, regardless of code-path correctness.

We chose single-tenant for three reasons:

  • Trust. Intelligence customers don't want their queries in a shared SaaS pool. Per-tenant is the trust position.
  • Auditability. Single-tenant audit logs are clean. Multi-tenant ones require constant filtering.
  • Failure isolation. A bug in one customer's pipeline can't poison another customer's data.

Provisioning is one Cloud Run deploy + one migration. We never multi-tenant for cost reasons; we'd rather charge more.

Full security posture →

/07 · EXTENSIONS

Vertical workflows, on top of the platform.

WARGAME · ONE EXTENSION OF MANY

Extensions are vertical workflows that sit on top of the generic platform, behind a feature flag, with their own database tables and UI routes. The platform stays generic; extensions handle vertical-specific work.

Current extensions:

  • Wargame — multiplayer scenario play, role-scoped visibility, Adjudicator + Inject + After-Action agents. See the wargame extension page →
  • insigz Research — automated knowledge extraction: turns literature, filings, and reports into source-anchored assertions on the canonical model, with an evidence map, provenance drill-down, and a review queue. See the Research page →

Planned extensions (driven by customer demand, not roadmap-itis):

  • Maritime risk dashboard — claims-handler workflow for P&I clubs
  • Sanctions investigation workspace — beneficial-ownership traces + case templates
  • Energy disruption monitor — grid + LNG + price + news fused for trader-grade alerting
/08 · AUTONOMY ● LIVE

It watches for you. It never acts on its own.

DETECT & DRAFT · HUMAN COMMITS · Q10

The Autonomy Layer turns insigz from a platform you query into one that monitors continuously — while keeping the line that matters for compliance, journalism, insurance and policy buyers: it automates detection and drafting, never acting.

  • Standing Watches — a grounded agent runs against the live feed on a trigger or schedule and stages Proposals.
  • Proposal Inbox — the command queue: every staged draft is Accepted, Modified or Rejected by a human, with Explain and Show-Logic (the cited observations + reasoning) one click away.
  • Trust Evals — prove an agent before it ships: citation accuracy, refusal correctness, answer fidelity — emitted as a signed Scorecard you can attach to a report.
  • Analyst Studio — build new grounded agents without code; every one inherits citation-required and the refusal contract.

Bounded autonomy (doctrine Q10). An agent may auto-apply only internal, reversible outcomes above a high confidence threshold — attach an observation, flag an entity, raise an alert. Anything customer-facing or irreversible always stages for human review. Every auto-apply is reversible and audited.

/09 · ENTITY NETWORK

Every entity, every link, in one graph.

FORCE-DIRECTED · COLOURED BY COMMUNITY

Link analysis is where intelligence work actually happens — and where a list of rows fails you. The Entity Network renders the canonical model as a navigable graph: nodes are entities, edges are the ties derived from shared observations and events. You can grab it, spin it, and zoom it; it is a live 3D point cloud, not a static diagram.

  • Communities surface on their own. Nodes are coloured by detected community, so the clusters that matter — an ownership network, a port of convenience, a fleet — separate visually without you tagging anything.
  • Centrality reveals the connectors. The brighter and larger a node, the more central it is. The bridge entity that ties two clusters together is the one you usually want to look at first.
  • Every edge is grounded. A tie exists because observations and events say it does. Click a node to open the Entity Inspector and walk the evidence back to source.
  • Agent-suggested links are dashed. The autonomy layer can propose a tie it inferred; it stages as a dashed edge a human confirms or rejects — never a silent assertion (doctrine Q10).

Colour by community, by entity type, or by risk; brush to an ego-network around any node; jump straight from a node to its cases and reports. How the network is built →

/10 · PATTERN OF LIFE

What's normal — and what just broke it.

BASELINE BAND · ANOMALY DETECTION

An entity's rhythm is itself a signal. Pattern of Life plots an entity's activity over time against a robust baseline band — the range that activity normally sits in — and flags the moments it leaves the band. The question stops being "what happened" and becomes "what happened that shouldn't have."

  • Baseline, not a guess. The band is computed from the entity's own history with robust statistics, so a single noisy day doesn't move it and a genuine shift stands out.
  • Anomalies are scored. Each flagged bucket carries a deviation (robust-z) against the baseline and a direction — quiet when it should be busy, or busy when it should be quiet.
  • Brush a window or inspect a moment. Drag across the chart to quantify a span — total observations, peak, anomaly count against expected — or click a single bucket to inspect that moment and open the evidence.
  • It feeds the watches. A deviation is exactly the kind of trigger a Standing Watch fires on, staging a grounded Proposal for a human to act on.

Pattern of Life turns the canonical timeline into an early-warning surface — grounded, scored, and one click from the observations behind every spike. How baselines are scored →